Tracking and Reducing Your Amazon Return Rate with Analytics
In the competitive landscape of Amazon selling, every percentage point of your return rate directly impacts profitability, account health, and product visibility. For both FBA and FBM sellers, understanding and optimizing return rates has become a critical business function rather than a mere operational nuisance. Amazon return rate—the percentage of orders customers send back—serves as a key performance indicator that influences everything from profit margins to algorithm favorability. By leveraging sophisticated analytics approaches, today’s successful sellers diagnose root causes, implement targeted solutions, and continuously monitor performance to transform returns from a liability into a strategic advantage.
Throughout this guide, you’ll discover how to effectively track your Amazon return metrics, interpret the data to identify problematic patterns, implement data-driven strategies to reduce returns, and establish ongoing monitoring systems that support long-term business health.
Understanding Amazon return rate—and why it matters
Amazon return rate represents the percentage of sold items that customers send back relative to total orders. This seemingly simple metric carries outsized importance in the Amazon ecosystem, affecting multiple aspects of seller performance and profitability.
For sellers, elevated return percentages create a cascade of negative effects beyond the obvious cost of lost sales. They diminish advertising ROI by wasting spend on converted customers who ultimately return products. High return figures can trigger automated account health warnings, potentially leading to listing removals or account restrictions. Most critically, Amazon’s algorithm may reduce listing visibility for products with above-average return metrics, creating a downward spiral of reduced sales opportunity.
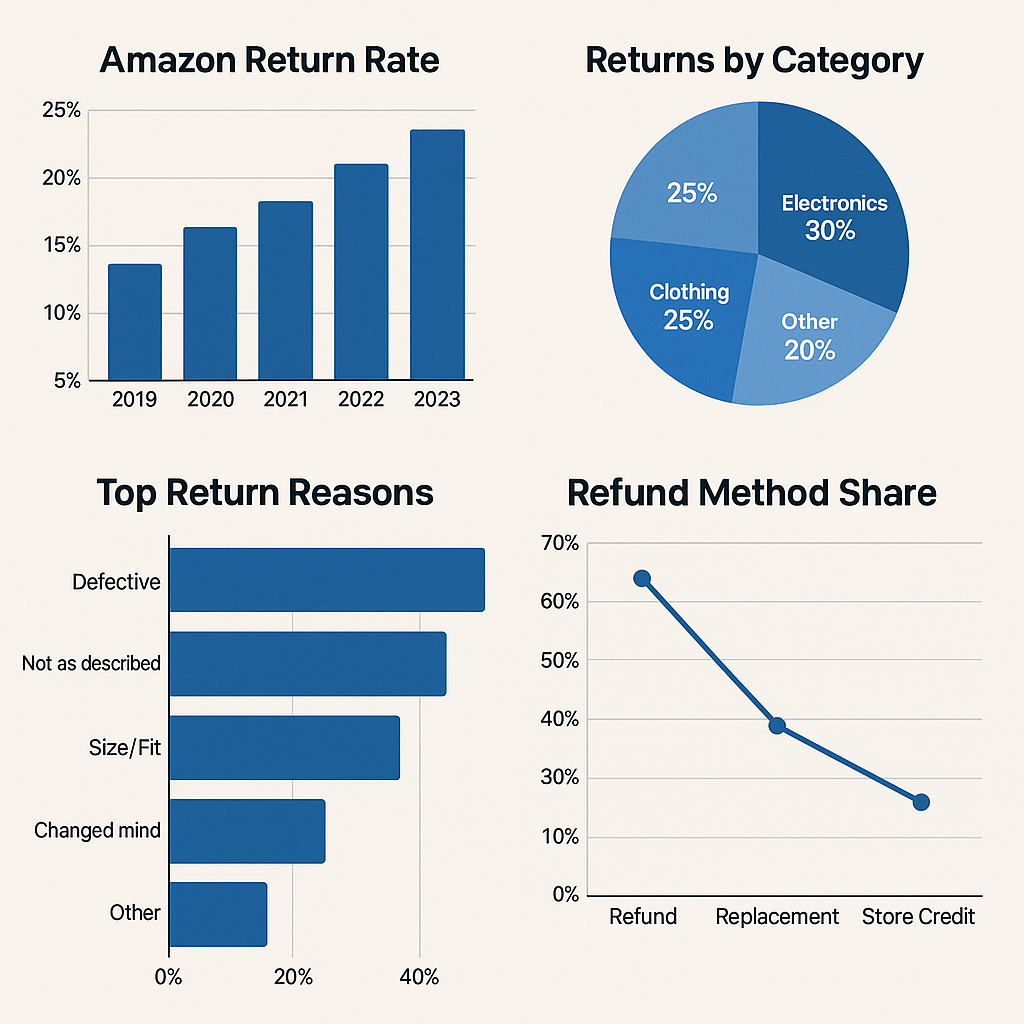
Return rates vary significantly across product categories.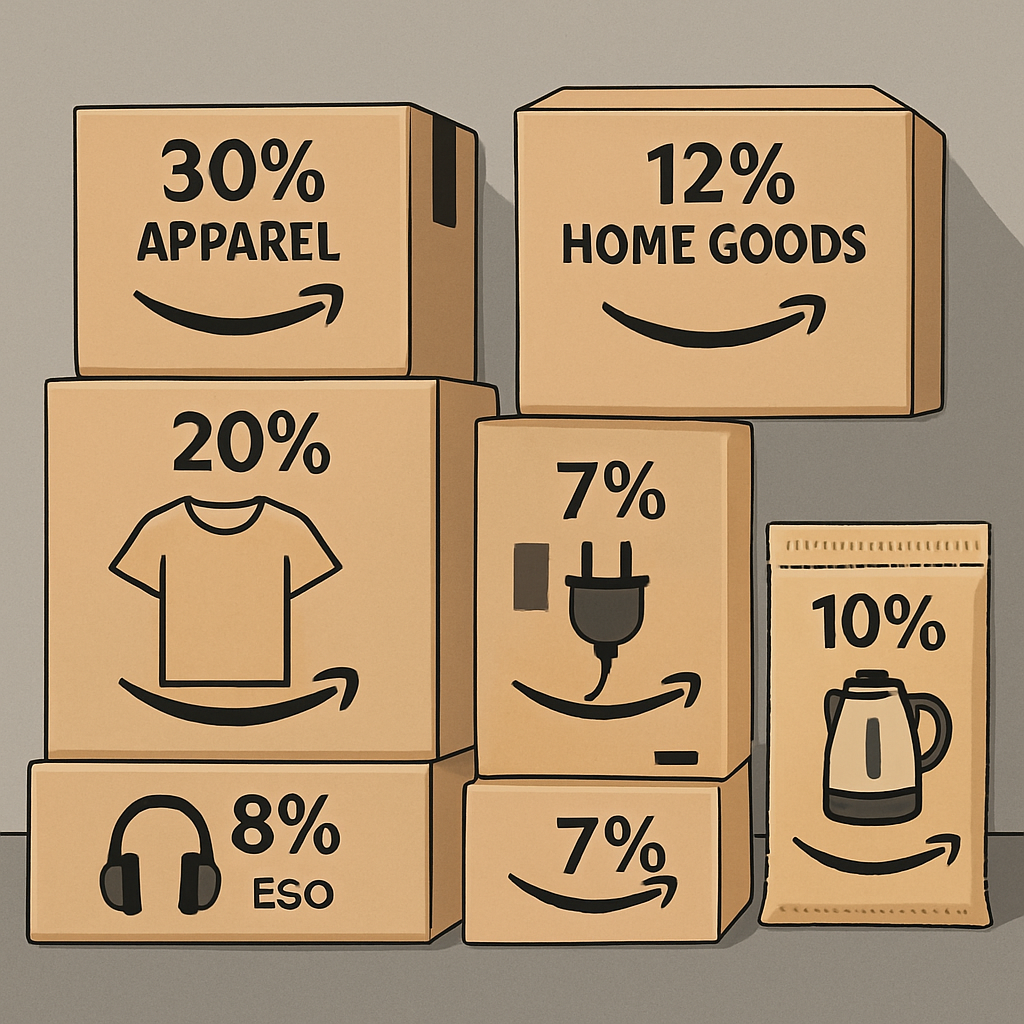
Apparel items typically experience higher rates due to sizing variations, while commodity products see substantially lower figures. Understanding your category benchmarks provides essential context for evaluating your performance and setting appropriate improvement targets.
With Amazon’s implementation of the Returns Processing Fee structure, sellers face direct financial penalties for excessive returns, particularly when caused by preventable issues like inaccurate descriptions or quality problems. This makes returns management not just a customer service concern but a substantial profit protection imperative.
How to track your Amazon return rate with analytics
Effectively monitoring return metrics requires utilizing a combination of Amazon’s native reporting tools and potentially third-party analytics solutions for deeper insights. Setting up proper tracking systems forms the foundation of any successful returns reduction strategy.
Using Voice of the Customer and Return Reports
Amazon provides several built-in tools to monitor return activity. The Voice of the Customer dashboard offers a high-level overview of customer dissatisfaction signals, including returns data. To access detailed information, navigate to Seller Central’s “Reports” section and locate the “Returns” report under “Fulfillment.” This report allows for downloading comprehensive return data including reasons, dates, and affected ASINs.
For systematic tracking, establish a regular cadence for downloading and analyzing these reports—weekly monitoring allows for timely intervention while monthly reviews help identify longer-term patterns. Pay particular attention to return reason codes, which provide invaluable insights into specific improvement opportunities.
The Returns Report enables sorting by ASIN, helping identify problematic products that may be driving your overall return percentage higher. Focus especially on products with return rates significantly above your account average or category benchmarks—these represent your highest-value improvement opportunities.
Integrating third-party analytics for deeper insights
While Amazon’s native tools provide essential data, specialized analytics platforms offer more sophisticated analysis capabilities. These solutions automatically aggregate return information, calculate meaningful metrics, and visualize trends that might otherwise remain hidden in raw data.
Advanced analytics platforms connect return data with other business metrics like advertising performance, profitability, and customer feedback scores. This integration allows for correlation analysis that reveals how returns impact overall business health and which operational improvements yield the greatest return reduction results.
Benchmark capabilities represent another advantage of specialized tools, allowing sellers to compare performance against category averages or marketplace standards. This comparative view helps prioritize improvement efforts toward products with truly problematic return rates rather than those that simply reflect category norms.
Whether using native tools or specialized platforms, the key metrics to track include overall return rate, return rate by ASIN, return reasons by percentage, seasonal patterns, and trend lines showing improvement or deterioration over time.
Diagnosing the root causes of returns
Effective returns management requires moving beyond simple counting to understanding underlying causes. Return analytics provide visibility into patterns that point toward specific operational or listing deficiencies requiring attention.
Product quality issues frequently drive returns, particularly for private label sellers managing overseas manufacturing relationships. Analytics can reveal spikes in “defective” or “not as described” returns that suggest manufacturing inconsistencies or quality control failures. When these patterns emerge, targeted product inspections or supplier conversations become necessary.
Listing accuracy problems represent another major return driver. When metrics show customers frequently citing “different from website description” as their return reason, this signals misalignment between customer expectations and reality. Product dimensions, functionality claims, color representation, or compatibility information may require correction to better align with the actual product.
Sizing concerns particularly impact apparel, footwear, and consumer goods categories. Return data showing size-related reasons can indicate needed improvements in sizing charts, fit descriptions, or product photography. Analytics tools that segment returns by size or style can identify specific variants with elevated return percentages.
Logistical issues also emerge through return analysis. When damaged items drive returns, packaging improvements may be warranted. Similarly, late deliveries leading to “no longer needed” returns suggest reevaluating fulfillment methods or inventory placement strategies.
Advanced sellers look beyond individual return reasons to identify correlations between return patterns and other variables like sales channel, price point, or customer segment. These multi-dimensional analyses often reveal subtle optimization opportunities that basic reporting might miss.
Strategies to reduce Amazon return rates using data
Once analytics have revealed your specific return drivers, implementing targeted improvements becomes possible. Data-driven return reduction focuses on addressing root causes rather than symptoms, leading to sustainable improvements in customer satisfaction and profitability.
Listing optimization based on return analytics
Product detail pages often represent the most effective intervention point for reducing returns. When metrics indicate customer expectations misalignment, strategic listing enhancements can drive significant improvements.
Descriptive content improvements should address specific return reasons identified in your data. For products with fit or size-related returns, enhanced sizing charts with detailed measurements help customers make informed decisions. For functional items showing “does not work as expected” returns, clarifying capability limitations or usage requirements prevents disappointment-driven returns.
Visual content optimization proves equally important. Products with high “appearance different than expected” return rates benefit from additional photography showing multiple angles, contexts, or size comparisons.
For color-sensitive items, ensuring photographs accurately represent actual colors can substantially reduce returns.
Customer question analysis provides another data point for listing improvements. Questions frequently asked in the Q&A section often highlight information gaps in your listing that could be driving returns. Incorporating answers to these questions directly into product descriptions preemptively addresses potential misunderstandings.
Optimizing fulfillment & packaging
Fulfillment optimization targets returns caused by damage, delivery issues, or other logistical factors. For products showing elevated damage-related returns, packaging enhancements like additional cushioning, more secure sealing, or specialized shipping containers may be warranted.
Inventory distribution strategies impact delivery timeframes, which affect “no longer needed” returns. Analyzing return patterns by fulfillment region can reveal opportunities to reposition inventory closer to customer concentrations experiencing higher return rates.
For FBM sellers, carrier selection significantly impacts damage rates and delivery timeliness. Return analytics may reveal certain carriers or service levels associated with higher return percentages, suggesting the need for fulfillment partner adjustments.
Leveraging post-sale support data
Customer communication provides valuable opportunities to prevent returns through proactive engagement. For products showing high return rates, implementing post-purchase email sequences with usage tips, assembly guidance, or fit recommendations can preemptively address common issues before they lead to returns.
Customer service interactions often reveal return triggers not captured in standard return reason codes. Analyzing support tickets associated with returns can uncover specific customer pain points requiring attention through product modifications, improved instructions, or enhanced pre-purchase information.
Strategic interventions for products with concerning return rates might include direct customer outreach. For high-value items or those showing sudden return spikes, contacting purchasers shortly after delivery to address questions or concerns can substantially reduce return likelihood.
Reporting, benchmarking, and continuous improvement
Sustainable return rate optimization requires establishing systematic monitoring and improvement processes. Implementing structured reporting frameworks enables ongoing visibility into performance trends and intervention effectiveness.
Effective return reporting combines multiple metrics into comprehensive dashboards or reports. Key elements include overall account return rate, return rates by product category and individual ASIN, return reason distribution, and trend lines showing changes over time. Segmentation by fulfillment method, price point, or customer type provides additional analytical depth.
Benchmark integration adds critical context to raw return figures. Comparing performance against category averages, marketplace standards, or internal targets helps distinguish between expected return levels and problematic outliers requiring intervention. This contextual understanding prevents overreaction to normal return patterns while highlighting genuine issues.
Continuous improvement mechanisms transform analytics into ongoing optimization.
Implementing regular review cycles—weekly for tactical adjustments, monthly for strategic evaluation—ensures return insights translate into concrete improvements. Documenting interventions and their results creates an institutional knowledge base of effective return reduction techniques.
Integration with broader business metrics provides holistic performance understanding. Correlating return rate improvements with changes in advertising efficiency, organic ranking, profit margins, or customer lifetime value quantifies the full business impact of return reduction efforts.
For sustained success, establish a returns governance process designating specific team members responsible for monitoring return metrics, investigating concerning patterns, implementing improvements, and tracking results. This accountability structure transforms returns management from reactive firefighting into strategic business optimization.
By treating returns as a data-driven optimization opportunity rather than an unavoidable cost of doing business, Amazon sellers can substantially improve profitability while enhancing customer satisfaction. The systematic application of analytics to understand, address, and continuously monitor return drivers creates a virtuous cycle of improvement that strengthens competitive position and builds long-term marketplace success.
Frequently asked questions
How do I check my Amazon return rate?
Most sellers can monitor return rates in Seller Central under the “Voice of the Customer” dashboard or by downloading Return Reports by ASIN/SKU.
What’s a good Amazon return rate?
Return rates vary by category, but 5–10% is average; apparel/electronics may be higher. Always benchmark against your category.
Why does Amazon care about my return rate?
High return rates impact your seller performance, can trigger penalties/fees, and may reduce your product visibility or account health.
What’s the most effective way to reduce returns?
Use analytics to identify root causes—often unclear descriptions, quality issues, or poor fit—and address them proactively in listings and operations.
Can analytics tools really help me lower my Amazon return rate?
Yes, tools that track, categorize, and visualize returns make it easier to spot trends and implement targeted improvements for lasting impact.