Amazon Traffic Analysis: Find Out Where Your Shoppers Come From
Understanding where your Amazon shoppers come from isn’t just a nice-to-have insight—it’s essential intelligence that can transform your marketplace strategy.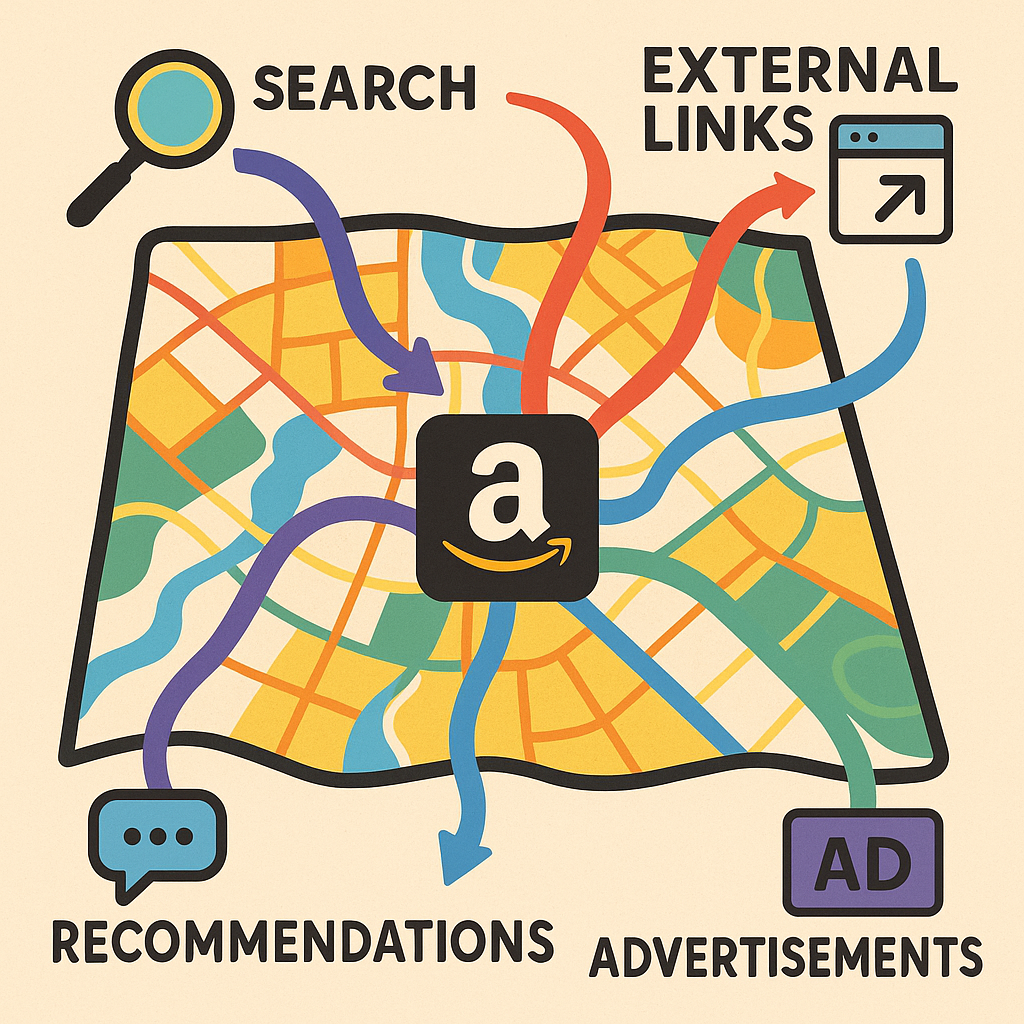
Whether you’re managing brands through Vendor Central or selling directly through Seller Central, traffic analysis serves as the foundation for sustainable growth on the platform. By uncovering the origins of your customer journections, conversion patterns, and engagement metrics, you can make data-driven decisions that enhance visibility, optimize spend, and ultimately drive more sales.
In this comprehensive guide, we’ll explore how to access, interpret, and leverage Amazon traffic data to understand buyer behavior across the platform. You’ll discover practical approaches to monitoring traffic sources, diagnosing performance issues, and implementing targeted solutions that can elevate your Amazon business to new heights.
Understanding Amazon traffic metrics: the foundations
Before diving into traffic sources and optimization strategies, we need to establish a clear understanding of Amazon’s core traffic metrics.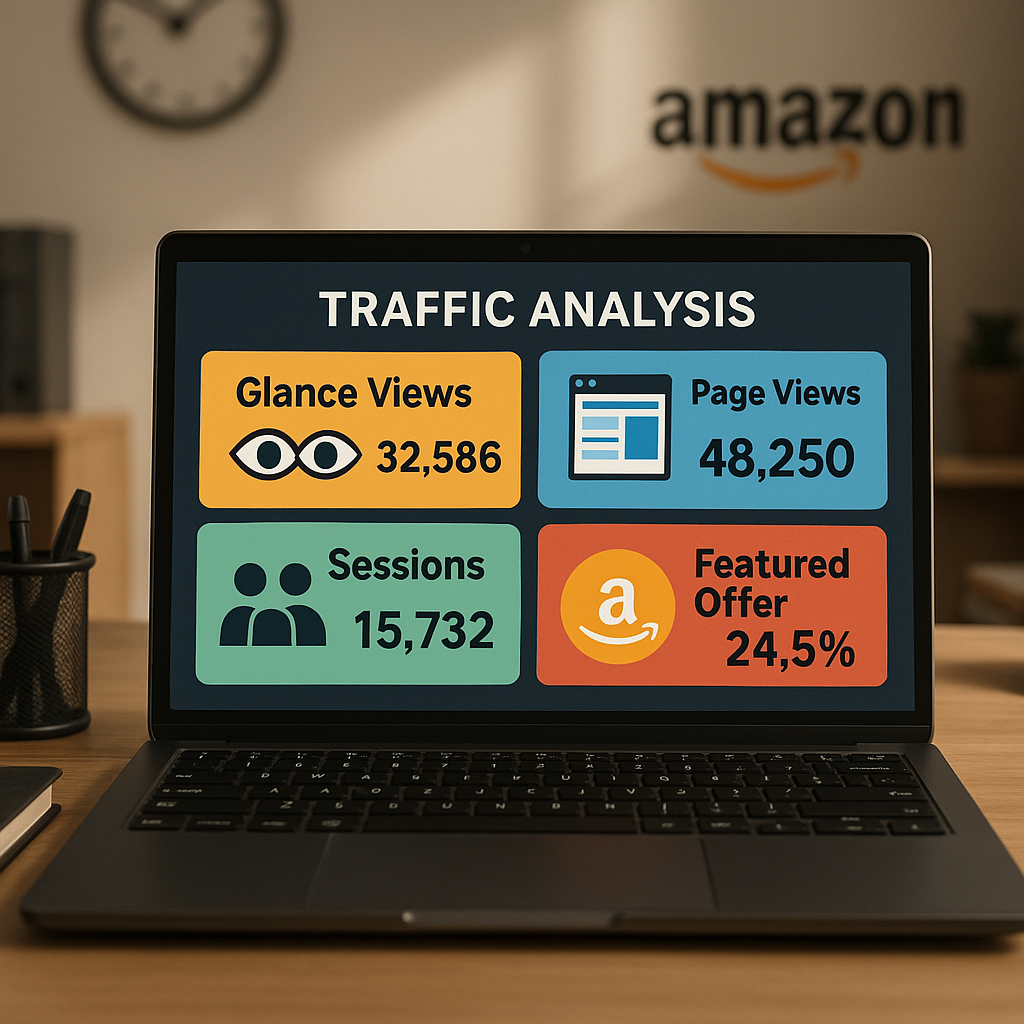
These foundational measurements provide the lens through which all customer behavior is analyzed on the platform.
Glance Views and Featured Offer Page Views
Glance views represent one of the most important visibility metrics on Amazon. A glance view is recorded each time a customer sees your product in search results, browse pages, or recommendation widgets. For vendors and sellers, this metric indicates your product’s discoverability within Amazon’s ecosystem.
Featured offer page views, meanwhile, specifically track instances where your product appears as the default purchasing option (the “Buy Box” for sellers or the featured offer for vendors). This refined measurement helps distinguish between general visibility and opportunities where your specific offer is prominently displayed to shoppers.
According to current Amazon reporting standards, featured offer visibility directly correlates with conversion potential—when your product isn’t in this position, conversion rates typically plummet by 70-80%, regardless of overall page traffic.
Sessions and Page Views: What’s Different?
While often confused, sessions and page views represent distinct dimensions of customer engagement. A session encompasses a customer’s entire visit to Amazon, from arrival until departure or inactivity timeout (typically 30 minutes). Each visitor may generate multiple page views within a single session as they browse product listings, check reviews, or compare options.
For 3P sellers, Seller Central provides access to both session and page view data through Business Reports. Vendors, however, receive more limited session data through Retail Analytics, with the primary focus on glance views and featured offer metrics instead.
Understanding this distinction becomes crucial when calculating accurate conversion rates. Page views might indicate interest, but sessions provide a more accurate denominator when determining the percentage of visitors who ultimately purchase.
Limitations and Data Gaps
Despite the wealth of information available, Amazon’s traffic reporting has notable limitations. Vendors lack the granular session-level data that sellers receive, making detailed conversion analysis challenging. Furthermore, neither platform provides complete visibility into Buy Box win rates over time—sellers must manually calculate this by comparing featured offer views against total detail page views.
Additionally, Amazon’s attribution model doesn’t always distinguish between traffic sources with perfect clarity. External traffic arriving through Amazon’s own mobile app, for instance, may be categorized differently than identical traffic arriving through mobile browsers. These limitations necessitate a comprehensive analytical approach that considers multiple data points to draw accurate conclusions.
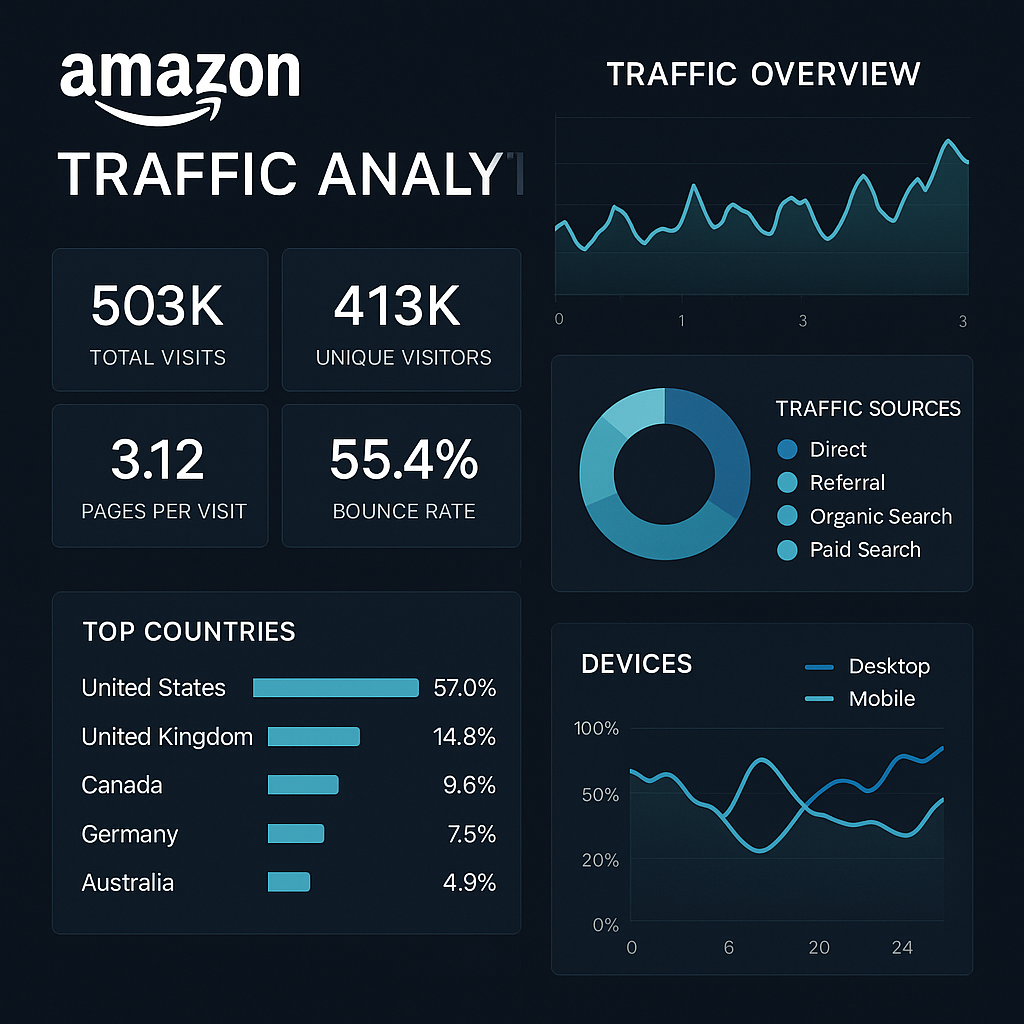
Identifying Amazon traffic sources: where do your shoppers come from?
Amazon shoppers arrive at your product listings through a complex web of entry points. Understanding these diverse pathways illuminates opportunities to optimize visibility and conversion across the platform.
Organic vs. Paid Traffic
Organic discovery remains the backbone of Amazon success.
Customers find products through keyword searches, category browsing, and Amazon’s recommendation algorithms. These pathways generate traffic without direct advertising expense, though they require investment in listing optimization, review generation, and performance metrics to improve ranking factors.
Paid placements, conversely, include Sponsored Products, Sponsored Brands, Sponsored Display, and Amazon DSP advertising. These channels offer precise targeting but come with advertising costs that must be factored into profitability calculations. Amazon’s advertising console provides attribution data showing exactly which ad placements drive impressions, clicks, and conversions—creating a clearer picture of return on investment than organic channels typically allow.
The balance between these sources varies dramatically by category and product lifecycle stage. New launches typically require heavier advertising investment to generate initial visibility, while established products with strong organic ranking may benefit more from defensive advertising strategies that protect their position.
The Role of Brand Stores and External Traffic
Brand Stores serve as customizable destinations within Amazon’s ecosystem, functioning as both traffic recipients and generators. When linked from Sponsored Brand campaigns, social media, or external websites, they create immersive brand experiences that can significantly lift conversion rates compared to standard product detail pages.
External traffic—arriving from Google searches, social media, email marketing, or direct website links—represents an increasingly important segment for sophisticated sellers. Amazon’s Attribution program now allows tagging of these external campaigns, providing insight into which off-platform investments drive Amazon sales.
Notably, Amazon has begun incentivizing external traffic through programs like Brand Referral Bonus, which offers up to 10% cashback on sales attributed to external sources. This creates an economic incentive to develop multichannel strategies rather than relying solely on Amazon’s internal traffic ecosystem.
How to access and analyze Amazon traffic data
Accessing your traffic data requires navigating specific reporting sections within Amazon’s selling platforms. The exact process differs between Vendor Central and Seller Central, with each offering unique perspectives on customer engagement.
Step-by-Step: Vendor Central Traffic Reports
For vendors, traffic data primarily resides within Retail Analytics Premium (RAP). To access these insights:
- Log into Vendor Central and navigate to the “Reports” tab
- Select “Retail Analytics” from the dropdown menu
- Choose “Traffic” from the available report types
- Set your desired date range and filtering parameters
- Export data or analyze directly within the platform interface
Key metrics available include glance views, featured offer percentage, detail page views, and unit session percentage (a simplified conversion rate). The reporting structure allows segmentation by ASIN, parent product, or category levels—providing both granular and broad perspectives.
For vendors seeking deeper insights, Amazon’s Brand Analytics offers additional traffic pattern analysis, including search term performance and market basket analysis. While not providing direct traffic attribution, these tools help identify which search terms drive discovery and which products frequently sell together.
Seller Central: Advanced Traffic Insights for 3P Sellers
Sellers enjoy more robust traffic reporting through Business Reports in Seller Central:
- Access Seller Central and click “Reports” in the top navigation
- Select “Business Reports” from the dropdown menu
- Navigate to “Detail Page Sales and Traffic” under “By ASIN”
- Customize date ranges and units (daily, weekly, monthly)
- Export reports or analyze specific ASINs directly in the interface
This reporting suite provides unit session percentage (conversion rate), total page views, total sessions, Buy Box percentage, and detailed sales metrics. Sellers can identify precise relationships between traffic fluctuations and sales outcomes—a significant advantage over the vendor reporting structure.
For advanced sellers, Amazon’s SP-API (Selling Partner API) offers programmatic access to traffic data, enabling custom dashboards and automated analysis. This approach requires development resources but delivers real-time insights without manual report generation.
Turning traffic data into action: diagnosing and solving issues
The true value of Amazon traffic analysis emerges when you transform raw data into actionable strategies.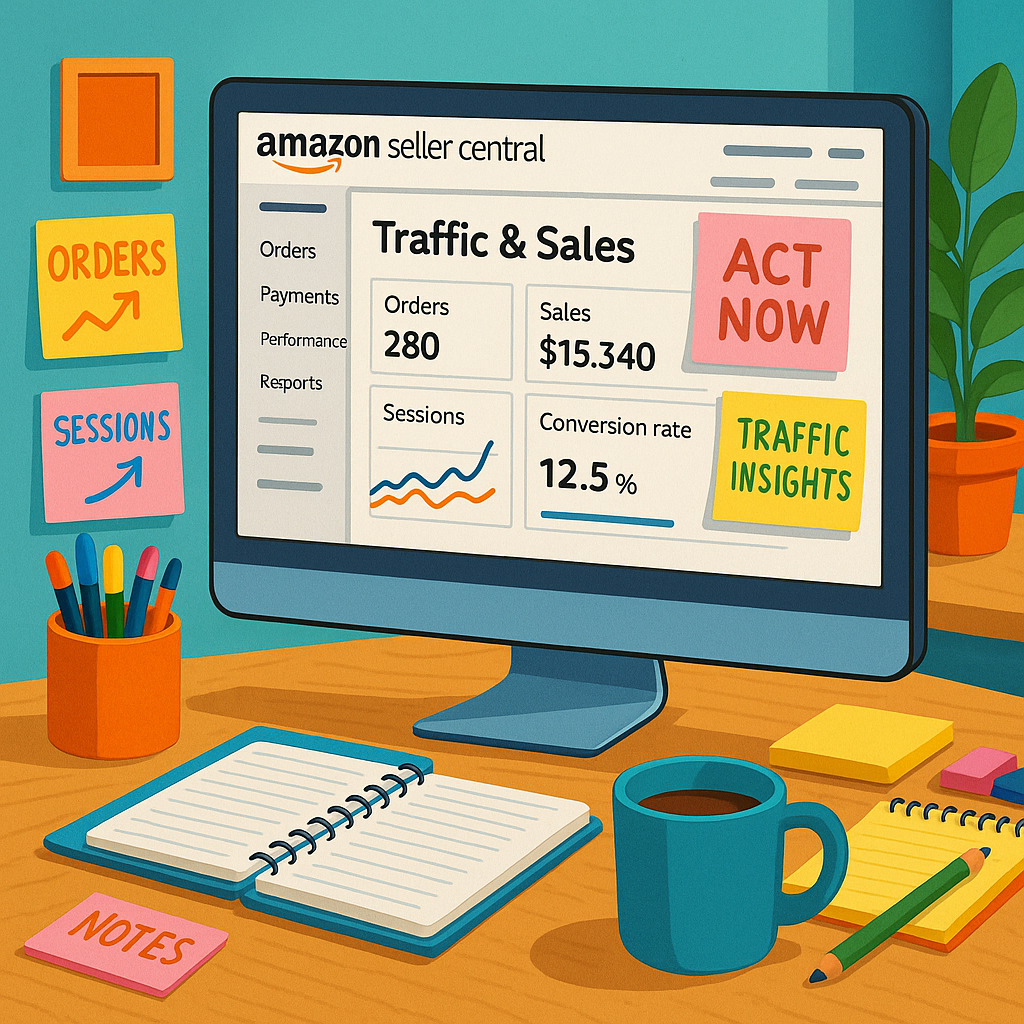
By recognizing patterns and anomalies in your traffic metrics, you can identify both problems and opportunities with precision.
Common Causes of Traffic Decline
When investigating decreased visibility or engagement, consider these frequent culprits:
- Inventory availability issues: Out-of-stock products lose both current visibility and algorithmic favor. Even brief stockouts can trigger extended recovery periods where organic ranking gradually rebuilds.
- Buy Box displacement: For sellers, losing the Buy Box to competitors dramatically reduces featured offer views. For vendors, manufacturer changes or competitive offers can similarly affect featured status.
- Catalog problems: Broken variation relationships, incorrect categorization, or detail page suppression can all restrict customer discovery pathways.
- Seasonal demand shifts: Some fluctuations reflect natural category seasonality rather than performance issues—distinguishing between these requires year-over-year comparison.
- Search algorithm updates: Amazon periodically adjusts its search algorithms, potentially affecting visibility for listings that don’t align with new ranking priorities.
Diagnosis requires connecting traffic patterns with specific events or changes. For example, if glance views remain stable but detail page views decline, customers may be seeing but not clicking your listings—suggesting potential issues with main images, pricing, or review ratings compared to competitors.
Proactive Monitoring Strategies
Rather than reacting to traffic crises, sophisticated Amazon businesses implement ongoing monitoring systems:
- Automated reporting: Schedule regular traffic reports with standardized metrics to quickly identify deviations from expected patterns.
- Segmented analysis: Monitor traffic not just at account level but by product category, price point, and lifecycle stage to identify micro-trends.
- Competitor benchmarking: Use Brand Analytics (for vendors and registered brands) or third-party tools to compare traffic share against category competitors.
- Performance thresholds: Establish minimum acceptable levels for key metrics like conversion rate, featured offer percentage, and traffic growth to trigger investigation when breached.
The most effective approach combines scheduled reviews with exception-based alerts. Rather than reviewing all ASINs daily, focus attention on products experiencing significant traffic deviations or falling below established performance thresholds.
When anomalies appear, investigate through a systematic process: first check inventory status and Buy Box position, then review recent catalog changes, followed by competitive positioning analysis. This structured approach prevents wasted effort on symptoms rather than root causes.
Conclusion
Amazon traffic analysis provides the visibility necessary to thrive in an increasingly competitive marketplace. By understanding where your shoppers come from, how they discover your products, and what influences their purchase decisions, you gain strategic leverage that can differentiate your brand from competitors.
The most successful Amazon businesses treat traffic data not as a passive reporting exercise but as an active business intelligence system. They continuously monitor pathways to purchase, optimize for high-performing traffic sources, and quickly diagnose visibility challenges before they significantly impact revenue.
Whether you’re operating through Vendor Central, Seller Central, or both, the principles remain consistent: gather comprehensive traffic insights, establish performance baselines, monitor for deviations, and implement targeted solutions when patterns change. This disciplined approach transforms Amazon’s complex ecosystem from an unpredictable marketplace into a manageable and optimizable sales channel.
Start by implementing regular traffic analysis routines focusing on your highest-priority ASINs. As you become more comfortable interpreting the data, expand your monitoring scope and depth. With practice, you’ll develop an intuitive understanding of normal traffic patterns for your catalog—making anomalies immediately apparent and actionable.
Frequently asked questions
How do I find out where my Amazon traffic comes from?
Access Vendor or Seller Central traffic reports and analyze metrics such as glance views, sessions, and external campaign performance.
What is a glance view on Amazon?
A glance view is registered each time your product detail page is loaded when your offer is in the buy box or featured offer spot.
Why is my Amazon traffic declining?
Common causes include Buy Box loss, out-of-stock status, catalog issues (like broken variations), and reduced discoverability due to suppression.
Can I see sessions or page views in Vendor Central?
Currently, Vendor Central provides primarily featured offer page views (glance views); sessions and broader page views are not available to vendors.
How can I increase Amazon traffic for my products?
Optimize for search, invest in targeted ads, ensure catalog accuracy, monitor Buy Box health, and analyze traffic data to react quickly to changes.