
Pro Design Tips for Effective Amazon Infographics
In today’s visually-driven marketplace, Amazon infographics have become essential tools for sellers looking to stand out in a sea of competition. These powerful visual assets blend strategic imagery, icons, and concise text to communicate product value instantly, address common buyer concerns, and create meaningful differentiation. Unlike standard product photos, well-designed infographics tell a complete product story, guiding potential customers through features, benefits, and usage scenarios in seconds—exactly when buying decisions are made.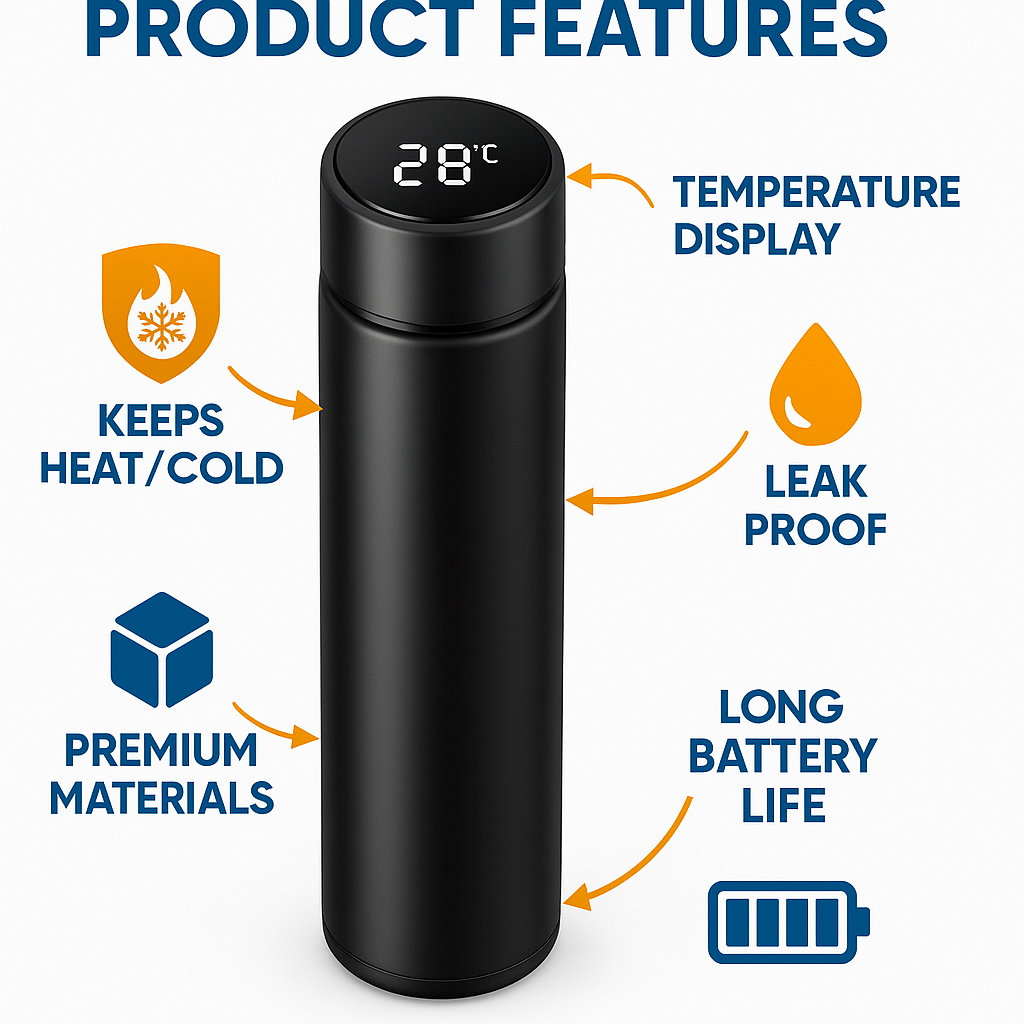
Throughout this comprehensive guide, you’ll discover how to create conversion-focused Amazon infographics that capture attention, build trust, and ultimately drive more sales. From understanding key design principles to implementing technical specifications and testing methodologies, we’ll cover everything you need to transform your Amazon listings with professional-quality visual content.
Why infographics matter for your Amazon listing
Amazon’s marketplace grows more competitive daily, with millions of sellers vying for limited customer attention. In this environment, infographics deliver crucial advantages that standard product photography simply cannot match.
Most Amazon shoppers make purchase decisions within seconds of viewing a listing. During this brief window, visually-organized information through product infographics provides the fastest path to understanding. Research consistently shows that humans process visual information approximately 60,000 times faster than text, making image-based communication ideal for e-commerce environments where attention spans are increasingly limited.
Beyond speed, these visual assets build essential trust. By professionally presenting product details, addressing common questions, and highlighting value propositions through organized graphics, sellers establish credibility that plain text descriptions cannot achieve alone. Listings utilizing professional infographics typically see higher conversion rates, reduced return rates, and improved customer satisfaction scores—performance metrics that Amazon’s algorithm directly rewards with improved search placement.
The most successful Amazon brands recognize that modern e-commerce shoppers operate with a visual-first mindset. Without the ability to physically interact with products, customers rely heavily on visual elements to make informed decisions. Strategic infographics bridge this sensory gap by illustrating size, context, materials, and functionality in ways that reduce purchase hesitation and objections.
Essential components of effective Amazon infographics
Creating high-converting listing visuals requires understanding the key elements that drive engagement and decision-making.
Successful product infographics consistently feature benefits-focused messaging that answers the customer’s primary question: “What’s in it for me?” Rather than simply listing features, effective designs translate technical specifications into practical advantages. For example, instead of stating “5000mAh battery,” a compelling infographic shows “2 full days of use without charging” with supporting visuals.
Visual clarity remains paramount, with high-resolution imagery that maintains crispness across viewing devices. Professional designs incorporate thoughtful white space distribution that prevents visual overwhelm and creates natural progression through information. The most effective layouts guide viewers through a logical sequence, with primary benefits receiving prominent placement and supporting details arranged in decreasing order of importance.
Brand consistency throughout infographic design reinforces recognition and professionalism. This includes maintaining your established color palette, typography standards, and iconography style across all listing images. Each infographic should feel like part of a cohesive visual family rather than disconnected assets.
Effective designs also anticipate and address common objections directly within the visual flow. This might include size comparisons with familiar objects, compatibility charts, warranty highlights, or ease-of-use demonstrations that overcome specific hesitations buyers typically have about your product category.
Mobile-first design considerations
With over 70% of Amazon browsing now occurring on mobile devices, optimization for smaller screens has become non-negotiable. Mobile-optimized infographics maintain readability by limiting text volume, increasing font sizes (minimum 14pt), and ensuring strong contrast between text and backgrounds.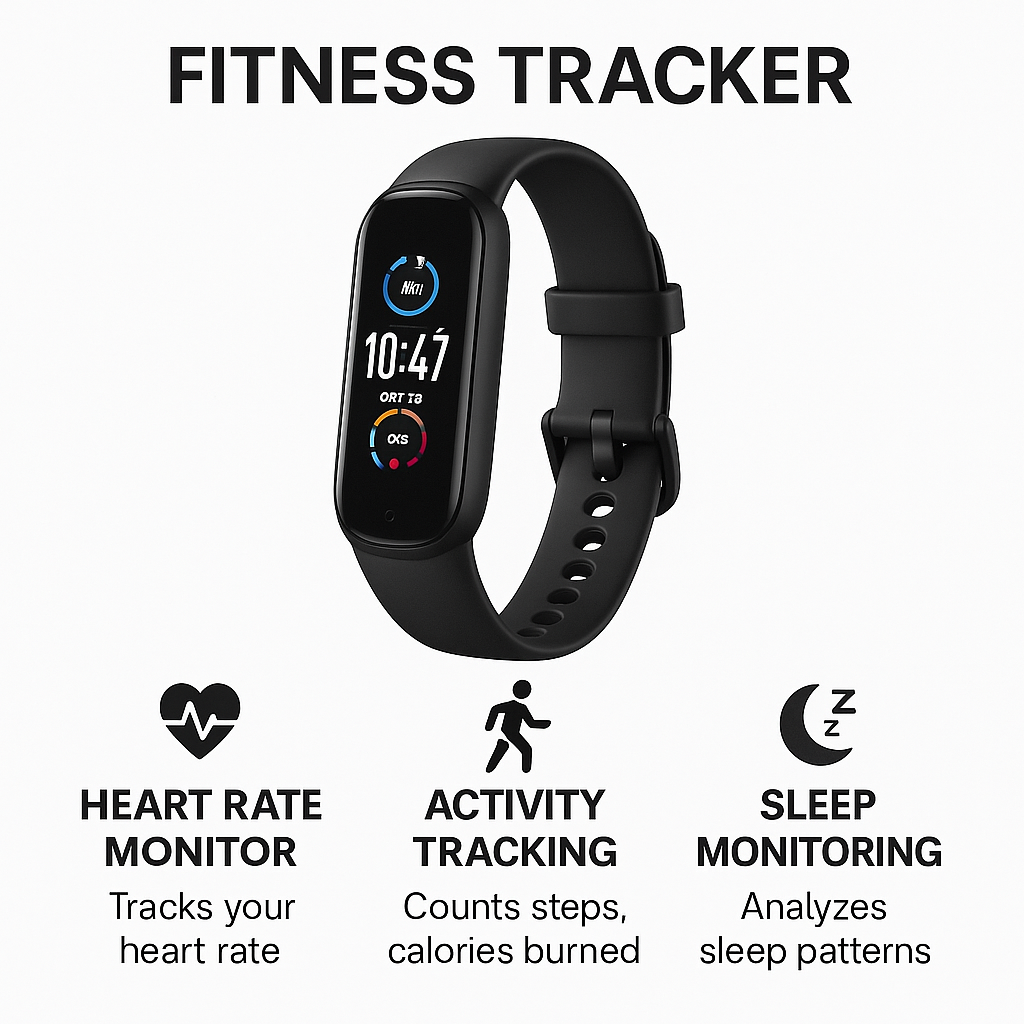
Successful mobile designs employ simplified layouts with fewer elements than desktop versions. Critical information should remain visible without zooming, particularly in thumbnail view where initial browsing decisions are made. Consider designing vertically-oriented infographics that align with natural mobile scrolling patterns and testing all designs on actual smartphone screens before finalizing.
Touch-friendly visual hierarchies also perform better, with primary messaging positioned in the center or upper portions where thumbs are less likely to obscure content during scrolling. Remember that mobile shoppers often browse in variable lighting conditions, making contrast and readability even more critical for these users.
Amazon’s technical image guidelines
Compliance with Amazon’s image requirements prevents listing suppression and ensures optimal display. All infographics must meet minimum resolution standards of 1000×1000 pixels, though 2000×2000 pixels provides ideal clarity for zoom functionality. The marketplace accepts JPG, PNG, and GIF formats, with JPG recommended for most applications due to optimal file size and quality balance.
Amazon strictly prohibits certain elements in product images, including promotional text like “sale” or “free shipping,” watermarks, contact information, or copyright symbols. The main product image (the one appearing in search results) has even stricter requirements—pure white background, no accessories not included with purchase, and the product filling at least 85% of the frame.
While secondary images allow more creative freedom, all must maintain professional quality, represent the actual product being sold, and comply with category-specific guidelines. Amazon regularly updates these requirements, so maintaining awareness of current standards through Seller Central announcements remains essential for ongoing compliance.
Types of infographics that boost Amazon sales
Different infographic styles serve specific strategic purposes in the buyer journey.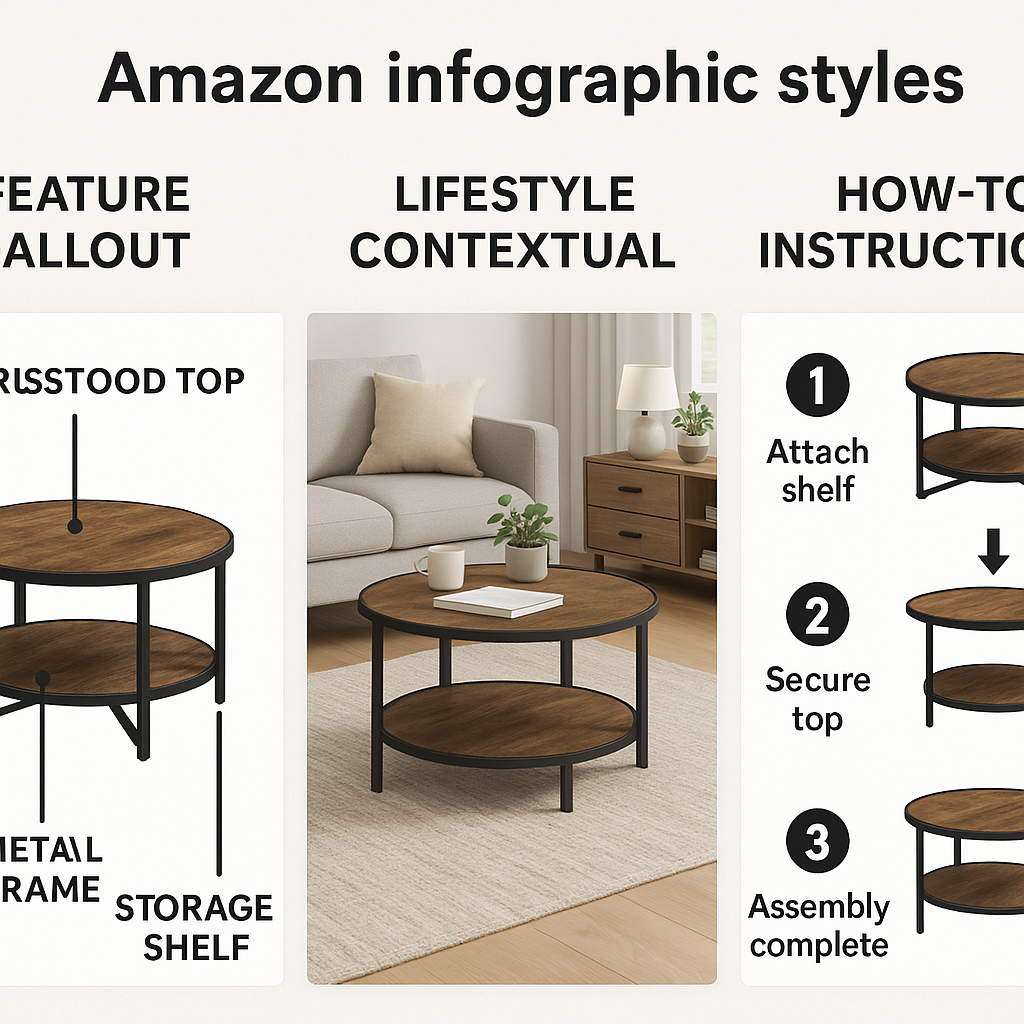
Understanding when and how to deploy each format maximizes their effectiveness.
Feature highlight infographics serve as the foundation of most successful listings. These designs isolate and explain key product features with callout lines pointing to specific areas of the product. The most effective examples pair each feature with a direct customer benefit rather than listing technical specifications alone. This format works particularly well for products with multiple functions or complex components that aren’t immediately obvious from external views.
Lifestyle contextual infographics place products in realistic usage scenarios, helping shoppers envision ownership. These designs show the item in authentic environments—a kitchen gadget in a modern kitchen, fitness equipment in a home gym setting—with real people demonstrating proper usage. This format builds emotional connection and helps establish proper scale and context that studio photography often lacks.
How-to/instructional infographics reduce purchase anxiety by demonstrating simplicity of assembly, usage, or maintenance. These step-by-step visual guides work particularly well for products that might appear complicated or require specific operational knowledge. Keeping steps minimal (typically 3-5 maximum) and visually clear encourages rather than overwhelms potential buyers.
Size and dimension infographics address one of the most common reasons for product returns—misunderstood scale. Effective designs show products alongside universally recognized objects for comparison (coins, smartphones, credit cards) or provide multiple measurement systems (inches/centimeters) with visual representations rather than numbers alone. For wearable or fashion items, model height and size information creates crucial context.
Comparison charts deliver powerful differentiation when positioned against competitor products or previous models. The most effective designs highlight your advantages without directly naming competitors, using visual cues like checkmarks and X-marks to quickly communicate superiority. This format works particularly well when you offer premium features at comparable price points or when overcoming specific objections about price by demonstrating value differences.
Example uses by category
Electronics listings benefit most from technical specification infographics that translate complex features into practical benefits. Effective designs for this category frequently include connectivity diagrams showing device ecosystems, battery life visualizations, and performance comparisons with previous generations or industry standards. Size comparison infographics addressing portability also perform particularly well in this category.
Beauty product listings typically leverage before/after imagery, ingredient callouts highlighting natural or active components, and application sequence graphics. The most successful infographics in this category often include texture close-ups that simulate tactile experiences impossible in standard photography.
Kitchen goods convert best with usage scenario infographics showing versatility across cooking applications, storage solution visualizations demonstrating space efficiency, and cleaning/maintenance simplicity graphics. Food-safe material callouts and capacity visualizations (showing exactly how much food fits in a container or appliance) also drive significant conversion improvements.
Fitness product listings perform strongly with anatomical benefit mapping that shows exactly which muscle groups or body systems benefit from use. Progressive result timelines, proper form demonstrations, and portability/storage solution visuals also consistently improve conversion metrics in this highly competitive category.
Step-by-step: designing infographics that convert
Creating conversion-focused listing visuals requires a systematic approach that balances customer needs with strategic marketing principles.
Begin by identifying your product’s top three customer pain points and corresponding solutions. Review customer questions, feedback on similar products, and competitor reviews to identify common concerns. These insights will form the foundation of your messaging hierarchy, ensuring your infographics address actual customer priorities rather than assumptions.
Next, analyze competitor listings to identify visual gaps and differentiation opportunities. Note which benefits competitors emphasize and which they overlook, paying particular attention to visual presentation styles, color schemes, and information density. Your infographics should maintain category conventions while establishing visual distinctiveness.
Content planning comes next, developing a clear information hierarchy that guides viewers through a logical progression. Sketch rough layouts determining where each benefit, feature explanation, and supporting element will appear. Consider the relationship between images: will they tell a sequential story across multiple infographics, or will each stand independently?
Gather all necessary assets before beginning design: high-resolution product photography from multiple angles, lifestyle images, icons, background textures, comparison data, testimonial excerpts, certification logos, and any other elements that support your messaging strategy.
During execution, maintain simplicity and clarity above all. Limit each infographic to 1-3 main messages with supporting details, rather than overwhelming viewers with information. Ensure text remains minimal, ideally under 20% of the total image area, with font sizes no smaller than 14pt for readability across devices.
Test completed designs by viewing them at thumbnail size, on mobile devices, and at full resolution. If information isn’t immediately clear at each viewing size, simplify further. Collect feedback from individuals unfamiliar with your product to ensure messaging clarity before finalizing.
DIY vs. hiring a professional designer
Self-creation offers immediate cost benefits and maximum control over messaging. Tools like Canva, Adobe Express, and Venngage provide templates specifically designed for e-commerce applications that can produce acceptable results with minimal design experience. This approach works well for sellers with limited SKUs, tight budgets, or those just testing product viability.
However, DIY approaches often reveal limitations in scaling, brand consistency, and conversion optimization. Amateur design elements like inconsistent spacing, poor typography choices, and inappropriate image resolution can undermine perceived product quality regardless of actual manufacturing standards.
Professional designers specializing in Amazon listings bring marketplace-specific expertise that generalist designers may lack.
These specialists understand Amazon’s technical requirements, category-specific conversion patterns, and the balance between information density and visual clarity that drives purchasing decisions in the platform’s unique environment.
The investment in professional design typically delivers strongest returns for premium-priced products where perceived quality directly impacts conversion, highly competitive categories where visual differentiation creates crucial advantages, and brands scaling beyond 10-15 products where consistency becomes increasingly difficult to maintain internally.
A/B testing, compliance & continuous improvement
Optimization doesn’t end with initial design—it requires ongoing refinement based on performance data and evolving marketplace conditions.
Amazon’s “Manage Your Experiments” tool allows sellers with Brand Registry to conduct controlled A/B tests on main images, infographics, and A+ Content. This feature provides statistically significant data on how visual changes impact conversion rates, helping isolate which design elements drive purchasing decisions. For those without access to this tool, third-party platforms like PickFu offer alternative testing methods through consumer panels.
When conducting tests, isolate specific variables rather than changing multiple elements simultaneously. Test one infographic approach against another, maintaining consistency in all other listing elements to ensure clear causality in results. Focus initial tests on your highest-traffic listings to gather data more quickly, then apply insights across your catalog.
Monitor key performance indicators beyond simple conversion rate. Track metrics like session percentage (how many listing visitors view all images), time on page, and return rate changes, which collectively provide deeper insights into how visual content impacts the customer journey and satisfaction.
Maintain vigilance regarding Amazon’s evolving content policies, which frequently change without extensive notice. Periodic policy reviews through Seller Central help prevent unexpected listing suppressions due to non-compliance with updated guidelines. Create a quarterly review process that evaluates both listing performance and policy alignment.
As your catalog grows, systematize your visual approach by creating brand-specific templates and style guides that ensure consistency. Document your most successful layouts, color applications, and messaging structures to streamline creation of new listing assets while maintaining brand identity.
The SEO side of Amazon infographics
While Amazon doesn’t directly index text within images for search purposes, infographics still impact search performance through indirect mechanisms. Product imagery influences click-through rates from search results, time on page metrics, and conversion rates—all factors in Amazon’s A9 algorithm that determines organic ranking.
Optimize image file names before uploading using your primary keywords separated by hyphens (e.g., “stainless-steel-water-bottle-insulated-24oz.jpg”). While this provides minimal direct ranking benefit, it creates additional relevancy signals and supports good listing hygiene.
For enhanced listings with A+ Content, Amazon does provide limited alt-text capabilities. Utilize these fields with concise, keyword-rich descriptions of each infographic’s content, focusing on product attributes and benefits rather than design elements. This text may be accessed by screen readers and potentially indexed by Amazon’s systems.
Ensure your infographic content visually reinforces the keywords you’re targeting throughout your listing. If targeting “ergonomic office chair,” your infographics should visually highlight ergonomic features with corresponding labels. This creates content coherence that supports relevancy signals while improving conversion for targeted search terms.
Remember that Amazon’s search algorithm heavily weights conversion performance—listings that convert better for specific search terms gradually improve in ranking for those terms. By creating infographics that effectively communicate benefits to specific customer segments, you indirectly improve search visibility through enhanced conversion rates.
Conclusion
Exceptional Amazon infographics represent the intersection of strategic marketing, visual design, and technical compliance—transforming standard listings into conversion powerhouses that stand out in increasingly crowded categories. By implementing the design principles, testing methodologies, and optimization strategies outlined in this guide, sellers can create visual assets that not only capture attention but systematically address buyer concerns at each stage of the decision process.
Whether you choose to develop these assets internally or partner with specialized designers, prioritizing visual communication through professional infographics delivers measurable advantages in conversion rates, customer satisfaction, and ultimately, sustainable business growth on the Amazon platform. In a marketplace where seconds determine sales outcomes, these visual assets provide the clarity and confidence shoppers need to choose your products over countless alternatives.
Remember that visual optimization is never truly complete—the most successful Amazon sellers maintain continuous improvement cycles, testing new approaches, refining messaging, and adapting to evolving customer preferences. By treating your listing visuals as strategic assets worthy of ongoing investment, you’ll build sustainable competitive advantages that support long-term marketplace success.
Frequently asked questions
How do I create an effective Amazon product infographic?
Focus on customer benefits, keep the design clean, prioritize mobile readability, and align with Amazon’s technical image requirements. Start by identifying key product benefits, create a logical information hierarchy, use high-quality product images, and incorporate clear, concise text that addresses common customer questions.
What are the best dimensions and file formats for Amazon infographics?
Minimum 1000×1000 pixels (2000×2000 ideal); JPEG or PNG formats in RGB color mode. Amazon requires square images for optimal display across all devices, with file sizes under 10MB. JPEGs work best for most applications, providing an optimal balance of quality and loading speed.
How many infographics should I include in my listing?
Use at least 3–5 infographics addressing features, benefits, sizing, and FAQs to provide a comprehensive product overview. The most successful listings typically include 5-7 infographics that systematically address different aspects of the product, with each image focusing on a specific theme rather than cramming too much information into a single visual.
Are there tools or templates for making Amazon infographics?
Yes—platforms like Canva, Adobe Photoshop, and Venngage offer templates; professional designers often use Adobe Creative Suite or Figma for advanced designs. For beginners, template-based tools provide the easiest entry point, while professional designers typically create custom templates aligned with specific brand guidelines for consistent catalog expansion.
Can infographics help with Amazon SEO?
Indirectly—infographics improve engagement and conversion rates, which Amazon’s algorithm rewards. A+ Content also allows keyword-rich alt text for visuals. While Amazon doesn’t directly index text within images for search purposes, the improved user metrics from effective infographics positively impact your product’s search visibility over time.