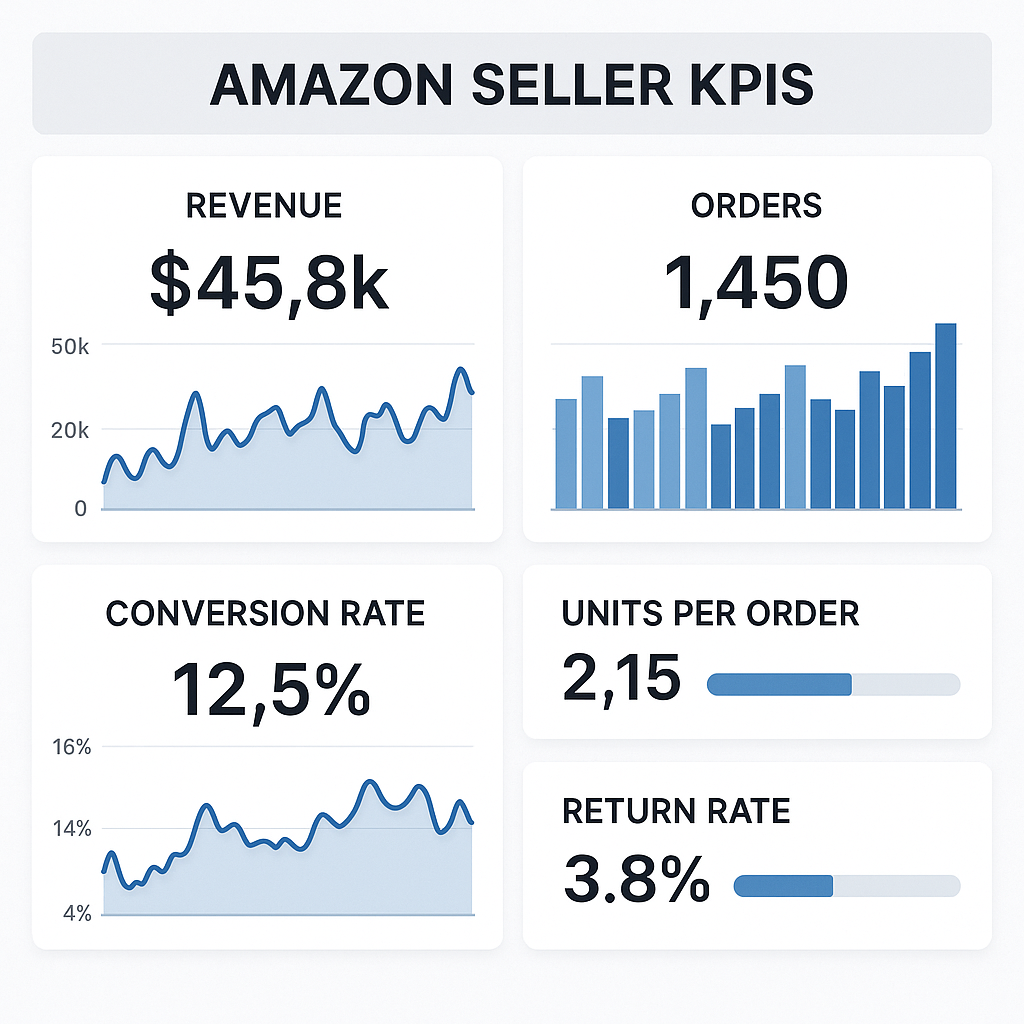
The 8 Most Important KPIs for Amazon Sellers
Success on Amazon isn’t merely about listing products and hoping for sales. Behind every thriving Amazon business lies a strategic approach to tracking and optimizing key performance indicators (KPIs).
These measurable metrics reveal the health of your business, highlight areas for improvement, and provide the roadmap for sustainable growth in the competitive Amazon marketplace.
While many sellers focus on “vanity metrics” like total sales or traffic volume, true business intelligence comes from monitoring actionable KPIs that directly influence profitability and operational efficiency. A key performance indicator for Amazon sellers is a measurable value that demonstrates how effectively you’re achieving your business objectives – from conversion optimization to inventory management and beyond.
In this comprehensive guide, we’ll explore the eight most critical performance metrics that can transform your Amazon business, why they matter, and practical strategies to improve each one. By mastering these essential measurements, you’ll gain the insights needed to make data-driven decisions that boost profitability, streamline operations, and accelerate your marketplace growth.
1. Conversion rate
Your marketplace conversion rate represents the percentage of listing visitors who complete a purchase. This vital metric serves as the ultimate indicator of your listing’s effectiveness and product demand.
A high conversion rate not only drives more immediate sales but also positively influences your product ranking in Amazon’s algorithm.
To calculate your product’s conversion rate, divide the number of orders by the number of sessions (visits to your listing) and multiply by 100. For example, if your listing receives 500 visitors and generates 50 orders, your conversion rate is 10%.
Most Amazon categories average between 5-15% conversion rates, with top-performing listings sometimes reaching 20% or higher. Numerous factors influence this metric, including:
- Image quality and quantity (main image is particularly crucial)
- Product title optimization with relevant keywords
- Pricing strategy relative to competition
- Product description clarity and bullet point persuasiveness
- Review volume and overall rating
- A+ content for brand registered sellers
To improve your Amazon conversion rate, implement A/B testing for images and product titles through services like PickFu or Amazon’s Manage Your Experiments tool (available to brand-registered sellers). According to marketplace specialists, enhancing product photography alone can increase conversion rates by 2-3 percentage points in many categories.
Monitor this metric through your Amazon Business Reports under “Detail Page Sales and Traffic.” Regular analysis can reveal patterns about which products convert best and which need listing optimization attention.
2. Order defect rate (ODR)
Order defect rate measures the percentage of your orders that result in a negative customer experience. Amazon calculates ODR by combining three key components: negative feedback, A-to-Z guarantee claims, and chargeback claims – divided by the total number of orders in a given period.
This metric is absolutely critical to your account health and selling privileges. Amazon requires sellers to maintain an ODR below 1% to remain in good standing. Exceeding this threshold can trigger account reviews, selling restrictions, or even suspension.
Several operational factors contribute to your ODR performance:
- Accuracy of product descriptions and images
- Packaging quality and product condition upon arrival
- Speed and reliability of shipping
- Customer service responsiveness and resolution quality
- Return and refund handling efficiency
To maintain a healthy marketplace standing, implement preventative strategies like regular quality control checks before shipping products, clear communication about shipping timelines, and prompt responses to customer inquiries (ideally within 24 hours). Setting up automatic email follow-ups through tools like Feedback Whiz or Jungle Scout can help address potential issues before they escalate to formal complaints.
Monitor your ODR performance in Seller Central under “Account Health” and set up notification alerts for any negative feedback or claims so you can address them immediately. Remember that resolving customer issues quickly can often result in feedback removal, directly improving your ODR.
3. Buy box percentage
The Buy Box is the coveted “Add to Cart” section on an Amazon product page, and securing it is essential for maximizing sales potential. Your Buy Box percentage indicates how often your offer appears in this prime position when customers view products you sell.
This metric is particularly important for sellers offering products with multiple competing offers. Industry data suggests over 80% of Amazon purchases happen through the Buy Box, making it perhaps the single most influential factor in driving sales volume for products with competition.
Amazon’s algorithm determines Buy Box eligibility and rotation based on several performance factors:
- Competitive pricing (not necessarily the lowest)
- Shipping options and speed
- Seller feedback rating and volume
- In-stock consistency and availability
- Order defect rate performance
- Customer service metrics
To improve your Buy Box share, maintain competitive pricing through automated repricing tools like Seller Snap or Aura, which adjust prices dynamically based on marketplace conditions. Ensure you have sufficient inventory levels to avoid stockouts, as these negatively impact your eligibility. For FBM sellers, offering expedited shipping options can significantly boost your competitiveness against other merchants.
You can track your Buy Box percentage in Seller Central under Business Reports > Detail Page Sales and Traffic. For products where you’re losing Buy Box share, analyze competitor offers to identify specific areas for improvement in your own listings.
4. Inventory performance index (IPI)
The Inventory Performance Index is Amazon’s comprehensive scoring system that evaluates how efficiently you manage your FBA inventory. This metric combines several inventory management factors into a single score ranging from 0 to 1000, with higher scores indicating better performance.
For FBA sellers, your IPI score directly impacts your storage limits and eligibility for certain programs. Amazon generally considers scores above 400 as good performance, though this threshold may change during peak seasons.
Four primary components influence your IPI score:
- Excess inventory percentage (items with supply exceeding projected demand)
- Sell-through rate (units sold versus average inventory held)
- Stranded inventory (items that can’t be sold due to listing issues)
- In-stock rate (percentage of time your popular products remain available)
To optimize your inventory performance, implement regular analysis of slow-moving products and consider running promotions to clear excess inventory. Use Amazon’s restock recommendations as guidance for maintaining appropriate inventory levels, but supplement these with your own sales forecasting for greater accuracy. Tools like Inventory Lab or Sellics can help identify inventory trends and optimize reorder quantities.
Regularly check for stranded inventory in Seller Central under Inventory > Manage Inventory > Fix Stranded Inventory, and resolve issues promptly. Setting up automatic removal orders for aged inventory (typically over 365 days) can help prevent long-term storage fees while improving your overall IPI score.
Monitor your IPI score in Seller Central under Inventory > Inventory Planning > Performance. Amazon updates this score weekly, so track it regularly to catch and address negative trends before they impact your storage limits.
5. Advertising cost of sale (ACoS) and return on ad spend (ROAS)
Advertising metrics provide critical insights into your promotional efficiency and profitability. ACoS (Advertising Cost of Sale) represents the percentage of attributed sales spent on advertising, while ROAS (Return on Ad Spend) shows how many dollars you earn for each dollar invested in ads.
These complementary metrics are calculated as follows:
- ACoS = (Ad Spend ÷ Ad-Attributed Sales) × 100
- ROAS = Ad-Attributed Sales ÷ Ad Spend
While these metrics are inversely related (a 25% ACoS equals a 4× ROAS), they serve different analytical purposes. ACoS helps evaluate campaign efficiency, while ROAS provides a clearer picture of return on investment. Additionally, TACoS (Total Advertising Cost of Sale) measures ad spend against total sales (not just ad-attributed sales) to gauge advertising’s overall business impact.
Determining “good” performance depends entirely on your profit margins and business objectives. For example, a 15% ACoS might be excellent for high-margin products but unsustainable for low-margin items. Similarly, new product launches might justify temporarily higher ACoS for market penetration.
To optimize these advertising performance indicators:
- Segment campaigns by performance goals (brand defense, new product launch, profitability)
- Implement negative keywords to prevent wasted ad spend
- Adjust bids based on conversion data and profit margins
- Test different match types to find the most efficient targeting
- Create separate campaigns for top-performing products
Monitor these metrics through Amazon’s Advertising Console, paying special attention to performance trends over time rather than daily fluctuations. Consider using specialized tools like Perpetua or Helium 10’s Adtomic for deeper PPC analytics and automated optimization.
6. Gross & net profit margin
While revenue metrics are important, profit margins ultimately determine your business sustainability and growth potential. Understanding both gross and net margins provides clarity on product profitability and overall business health.
Gross profit margin represents the percentage of revenue remaining after accounting for the cost of goods sold (COGS), calculated as:
Gross Margin = [(Revenue – COGS) ÷ Revenue] × 100
Net profit margin takes this calculation further by including all business expenses, not just product costs:
Net Margin = [(Revenue – COGS – All Expenses) ÷ Revenue] × 100
For Amazon sellers, expenses typically include:
- FBA fees (fulfillment, storage, removal)
- Referral fees (category-specific commission)
- Advertising costs
- Returns and refunds
- Product shipping to Amazon
- Software subscriptions and tools
- Staff or virtual assistant costs
- Professional service fees
Healthy gross margins for most Amazon categories typically fall between 25-40%, though this varies significantly by product type. Net margins for established Amazon businesses generally range from 10-20%, with newer businesses often operating at lower margins during growth phases.
To improve your profit margins, regularly analyze your product portfolio to identify both high and low performers. Consider discontinuing products with consistently poor margins unless they serve strategic purposes like customer acquisition. Negotiate better terms with suppliers as your order volume increases, and explore bundling opportunities to increase average order values.
Use Amazon’s FBA calculator before adding new products to your catalog to ensure profitability after all marketplace fees. For existing products, tools like Seller Legend or Helium 10’s Profits can provide detailed profit analysis across your entire catalog.
7. Inventory turnover rate
Inventory turnover measures how quickly you sell and replace your inventory within a specific timeframe. This efficiency metric reveals whether your capital is properly allocated or tied up in slow-moving stock.
The standard formula for calculating inventory turnover is:
Inventory Turnover = Cost of Goods Sold ÷ Average Inventory Value
A higher inventory turnover generally indicates efficient inventory management, while a lower rate suggests potential overstock issues or product selection problems. Most successful Amazon businesses aim for 4-6 inventory turns annually, though this benchmark varies by category and seasonality.
Slow-moving inventory impacts your business in several ways:
- Increased storage fees and potential long-term storage penalties
- Capital constraints limiting new product opportunities
- Higher risk of product obsolescence or expiration
- Negative impact on IPI score and storage limits
To optimize inventory turnover, implement just-in-time inventory practices for established products with predictable demand patterns. Use velocity reports from Seller Central to identify your fastest and slowest-moving SKUs, then adjust reordering quantities accordingly. For seasonal products, plan inventory buildups before peak seasons and strategic reductions afterward.
Consider liquidation strategies for persistently slow-moving inventory, including Amazon coupons, Lightning Deals, or even removal for sale through alternative channels. Tools like Forecastly or Inventory Planner can help automate this process by analyzing sales velocity and suggesting optimal reorder points.
Implement ABC inventory classification to focus your management efforts – with A-items (top 20% of sellers) receiving the closest monitoring, B-items (middle 30%) moderate attention, and C-items (bottom 50%) minimal oversight or consideration for removal.
8. Customer lifetime value (CLV)
Customer lifetime value represents the total worth of a customer to your business over the entire relationship. While many marketplace sellers focus solely on acquisition, understanding and optimizing CLV can dramatically improve long-term profitability.
The basic formula for calculating CLV is:
CLV = Average Order Value × Purchase Frequency × Average Customer Lifespan
Measuring CLV on Amazon presents unique challenges since the marketplace owns the customer relationship. However, brand-registered sellers can leverage several strategies to enhance customer retention and maximize lifetime value:
- Product inserts with QR codes linking to exclusive content or warranty registration
- Enrollment in Subscribe & Save programs for consumable products
- Strategic product line expansion to capture repeat purchases
- Amazon Stores that showcase your complete product catalog
- Post-purchase email sequences through Amazon’s Buyer-Seller Messaging system
- Remarketing through Amazon’s Sponsored Display ads
To improve CLV, focus on creating exceptional post-purchase experiences that encourage repeat business.
Invest in product quality and customer service to build brand loyalty that transcends individual transactions. Consider implementing a product ecosystem strategy where initial purchases naturally lead to complementary items from your catalog.
While Amazon doesn’t directly provide CLV metrics, you can approximate customer retention patterns by analyzing repeat purchase behavior in Brand Analytics (available to brand-registered sellers). Advanced analytics tools like Seller Pulse can also help identify purchase patterns and customer cohort behaviors over time.
Remember that increasing customer retention rates by just 5% can increase profits by 25-95%, making CLV optimization one of the highest-ROI activities for established Amazon brands.
Conclusion
Successful Amazon selling requires a balanced approach to performance measurement. While each of these eight KPIs provides valuable insights individually, their true power comes from analyzing them collectively to guide strategic business decisions.
Begin by establishing baseline measurements for each metric, then set realistic improvement targets based on your business stage and category benchmarks. Create a regular review cadence – daily for advertising metrics, weekly for operational KPIs like ODR, and monthly for more strategic indicators like profit margins and inventory turnover.
Implement a systematic action plan for each KPI: track the current performance, analyze the underlying factors, and execute specific improvements. Document your interventions and results to build an optimization playbook unique to your business.
By mastering these essential marketplace measurements, you’ll move beyond reactive selling to proactive business management – maximizing profitability, streamlining operations, and building a sustainable competitive advantage in the Amazon ecosystem.
Frequently Asked Questions
What are the most important Amazon KPIs for a new seller to track?
Start with Conversion Rate, Order Defect Rate, Buy Box Percentage, and Gross Profit Margin for an immediate impact on account health and growth.
How often should I review my Amazon KPIs?
Review weekly for ad/account health metrics (like ODR, ACoS), monthly for profitability and IPI, and quarterly for long-term trends like CLV.
What is a “good” conversion rate or ODR on Amazon?
A strong conversion rate on Amazon typically falls between 10-15%, while your ODR should always remain below 1%.
How do I improve my Buy Box percentage?
Optimize pricing, maintain sufficient stock, minimize ODR, and offer fast shipping—these all impact Buy Box eligibility.
Are KPIs different for FBA and FBM sellers?
The major KPIs are similar, but FBA sellers must closely watch IPI and storage fees, while FBM sellers should track shipping times and self-fulfillment metrics.